Futures markets thrive on expectations. Prices often move ahead of actual policy changes as traders act in anticipation, and few signals reset positioning as forcefully as the Federal Reserve’s dot plot.
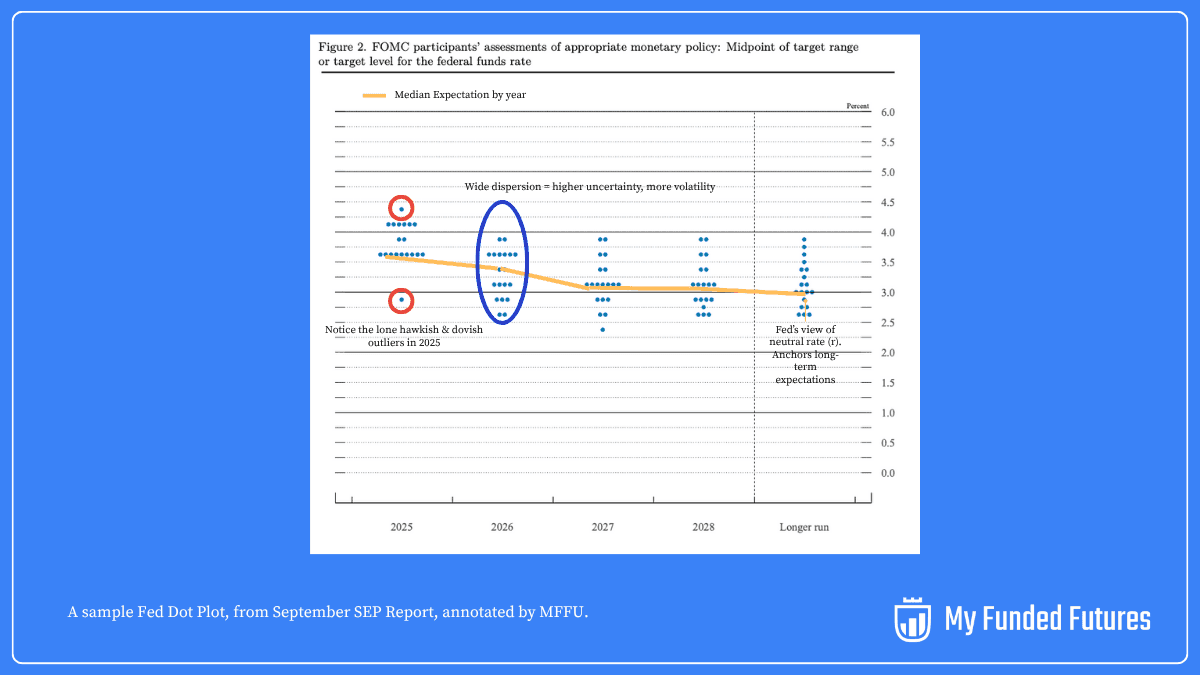
Published quarterly in the Summary of Economic Projections (SEP), the dot plot lays out where Fed policymakers believe the federal funds rate will sit at year-end for the next few years and in the longer run. Each dot is one member’s view.
The graphic looks simple; just scattered dots along a timeline. But each dot represents the judgment of an FOMC member whose decisions ripple across global markets.
What the Dot Plot Represents
The dot plot sets the baseline for expectations when it comes to federal funds rate. Every dot shows where one FOMC participant expects the number to land.
It’s not a forecast or a plan, and shifts with every round of data and every change in the Fed’s outlook. The dots capture the Fed’s thinking at a specific moment and become the baseline for market repricing.
Policymakers stress that the dots aren’t binding. “These individual forecasts are always subject to uncertainty… they are not a Committee plan or decision,” Fed Chair Jerome Powell said in June this year.
Why Futures Trader Fixate on the Dot Plot
The dot plot is highly-effective as a visual forward guidance tool for traders.
If all dots line up on the chart, it means broad consensus among the policymakers; if they are scattered, it shows significant disagreement.
It’s the Fed revealing its hand before the cards are played and traders want to capitalize on it, often triggering immediate repricing across asset classes including treasury futures, interest rate futures or forex.
Traders pay attention both to the median dot (the middle of all projections) and to any wide dispersion or outlier dots, as these convey the balance of dovish and hawkish views on the Committee.
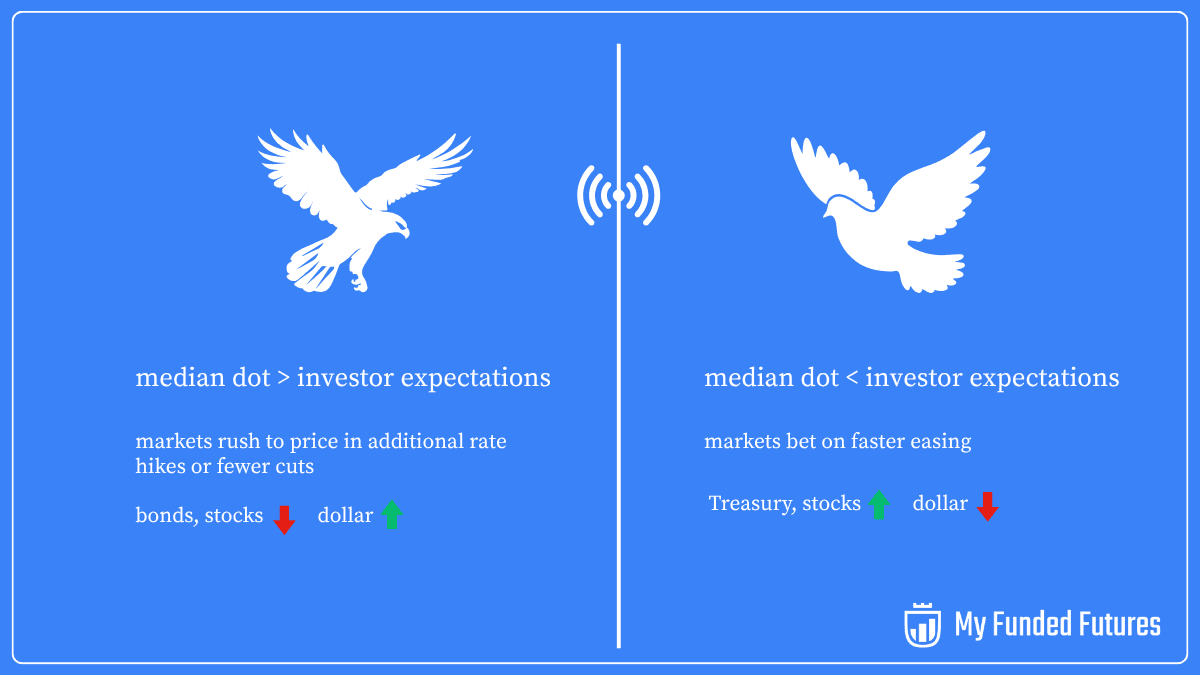
- A hawkish signal makes markets rush to price in additional rate hikes or fewer cuts while a dovish signal spurs markets to bet on faster easing.
- A one-step upward move in the median dot can reprice fed funds futures, Treasury futures, and ripple into FX and equity futures within minutes.
- In evaluation and live funded accounts, dot plot releases test risk management more than chart setups. Wide, sudden moves can blow through risk limits if traders aren’t prepared.
For futures traders, the dot plot is most directly relevant to short-term interest rate futures like 30-day Fed Funds futures and 3-month SOFR futures. These contracts reflect where traders think the federal funds rate is actually headed, so comparing the futures-implied rates to the Fed’s dots can reveal market skepticism or agreement with the Fed.
Traders can use tools like CME’s FedWatch to make such comparisons, and to plan trades around FOMC meetings.
A large divergence can be an opportunity. If you believe the Fed will stick to its higher-rate guidance, you might hypothetically position by shorting rate futures. If you suspect the Fed will eventually capitulate to a lower rate path, you might go long those futures.
These trades are tricky. Timing and risk management are crucial because data shows reconciliation between market and Fed expectations can take place over months, not just instantly at the meeting. During this wait period, every new economic data release can shift both the dots and market pricing.
Key Tips to Read the Dot Plot
Following are four key points to consider when analyzing the dot plot for your futures trading strategies.
1. Median vs. Mean
- Markets focus on the median dot because it minimizes the impact of extreme outliers.
- The mean can swing too much from one or two hawkish/dovish members, while the median shows where the “center of gravity” of the Committee lies.
2. Shifts Across Vintages
- Always compare the current SEP with the previous release.
- An upward shift in the median dot for next year often triggers immediate repricing in Fed Funds and SOFR futures.
- Even one-step (of 25 bps) moves can ripple across contracts within minutes.
3. The Terminal Rate
- Watch where the Committee believes the longer-run neutral rate (r*) sits.
- If the terminal dot rises, it suggests the Fed sees structurally tighter policy ahead.
- If it falls, markets may price a quicker return to easing.
4. Outliers and Dispersion
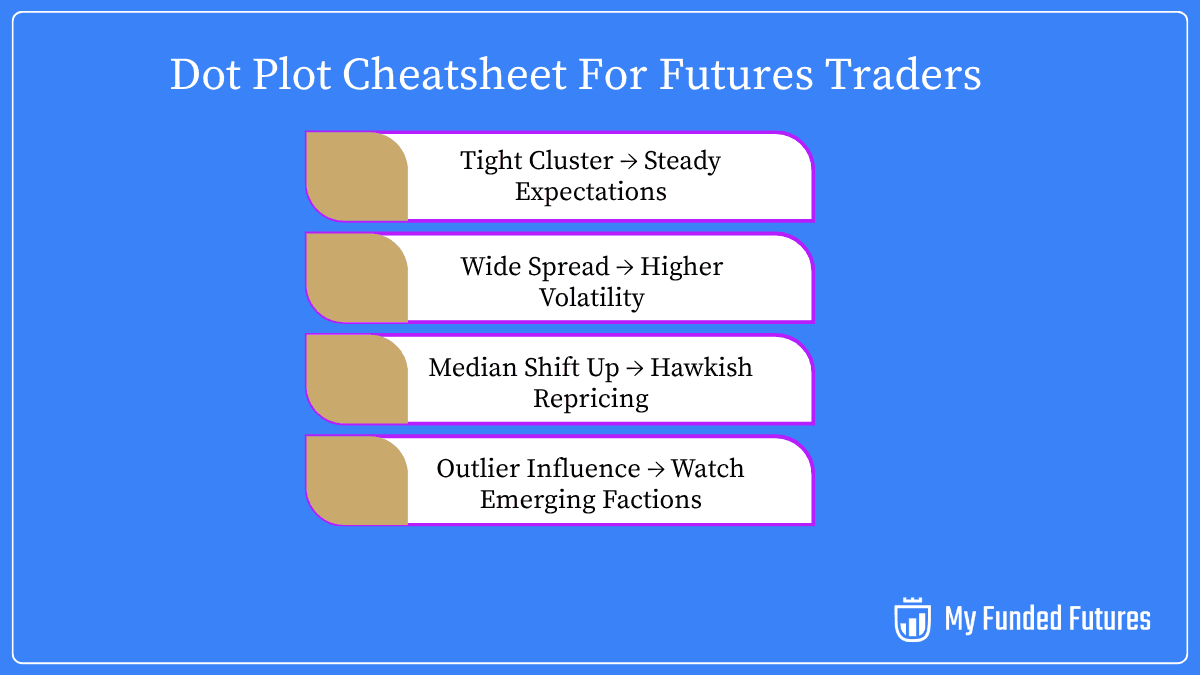
- A tight cluster of dots signals conviction and steadier expectations.
- A wide spread shows division and usually fuels volatility, since traders know future decisions could swing either way.
- Pay special attention to hawkish or dovish outliers, they sometimes hint at emerging factions inside the FOMC.
The Limits of the Dot Plot
- Short shelf life: Economic surprises, inflation swings, or labor data can render projections obsolete in weeks.
- Not a guarantee: Dots represent individual views that may change and are subject to uncertainty, as noted by Chair Powell.
- Trading danger: Building positions on dots two years out invites unnecessary drawdowns, especially in prop firm evaluations where risk discipline trumps long-horizon calls.
Takeaways for Futures Traders
Dot plot is an efficient tool, when traders treat it as a reference point, and not a roadmap.
- Focus on the market’s reaction, not the dots themselves.
- Plan ahead: define position sizes, slippage tolerance, and exit levels before the release.
- Use volatility to your advantage: fading extreme moves often offers opportunity once the initial dust settles.
As Powell put it: “If properly understood, the dot plot can be a constructive element of comprehensive policy communication.”
¹This material is provided for educational purposes only and should not be relied upon as trading, investment, tax, or legal advice. All participation in MyFundedFutures (MFFU) programs is conducted in a simulated environment only; no actual futures trading takes place. Performance in simulated accounts is not indicative of future results, and there is no guarantee of profits or success. Fewer than 1% of participants progress to a live-capital stage with an affiliated proprietary trading firm. Participation is at all times subject to the Simulated Trader Agreement and program rules.
Frequently Asked Questions
Rate this article
Related Posts
Read our most popular posts

What is MyFundedFutures Flex Account and is it the Right Plan for You?
The Flex Plan offers low-cost access, minimal restrictions, flexible risk rules, and a clear, structured path from simulation to live trading.

Gold vs. Silver Futures: Key Differences and Which Should Beginner Traders Choose?
Precious metals are rallying on economic and geopolitical uncertainty; while futures offer leverage, gold’s stability and liquidity make it a safer starting point than silver for beginners.

What Is MyFundedFutures Scale Account and Is It The Right Plan For You?
The MyFundedFutures Scale Account is a middle-tier evaluation plan that balances affordability with growth potential. The scale plan offers weekly payout opportunities with increasing withdrawal limits, no daily loss cap, and a clear path to live funding after just five consecutive payouts.