The conversations around futures trading may be dominated by technical analysis, but there are fundamental indicators that remain indispensable — more so for those dealing in commodities and equity index futures.
Performing fundamental analysis would provide a futures trader insight into underlying economic and supply-demand conditions that can drive price trends for assets that would not be apparent in charts.
At My Funded Futures, we emphasize that trading funded accounts is about protecting capital first. Fundamentals like these can either be opportunities or traps depending on how you manage risk.
US Employment Data
Futures traders mostly closely watch the Employment Situation report; monthly nonfarm payrolls (NFP) and the unemployment rate from the Bureau of Labor Statistics (BLS) are especially important.
The report is released on the first Friday of every month and provides a snapshot of the health of the labor market.
These reports often trigger some of the largest one-day moves in financial markets, whether it is stocks, bonds or futures, due to their implications for economic growth and monetary policy.
For example, the August 2025 NFP showed payrolls rising by only 22,000, compared to prior month’s 79,000 and expectations of 75,000.
This signaled a sharply cooling job market to watchers and immediately altered interest rate expectations for September.
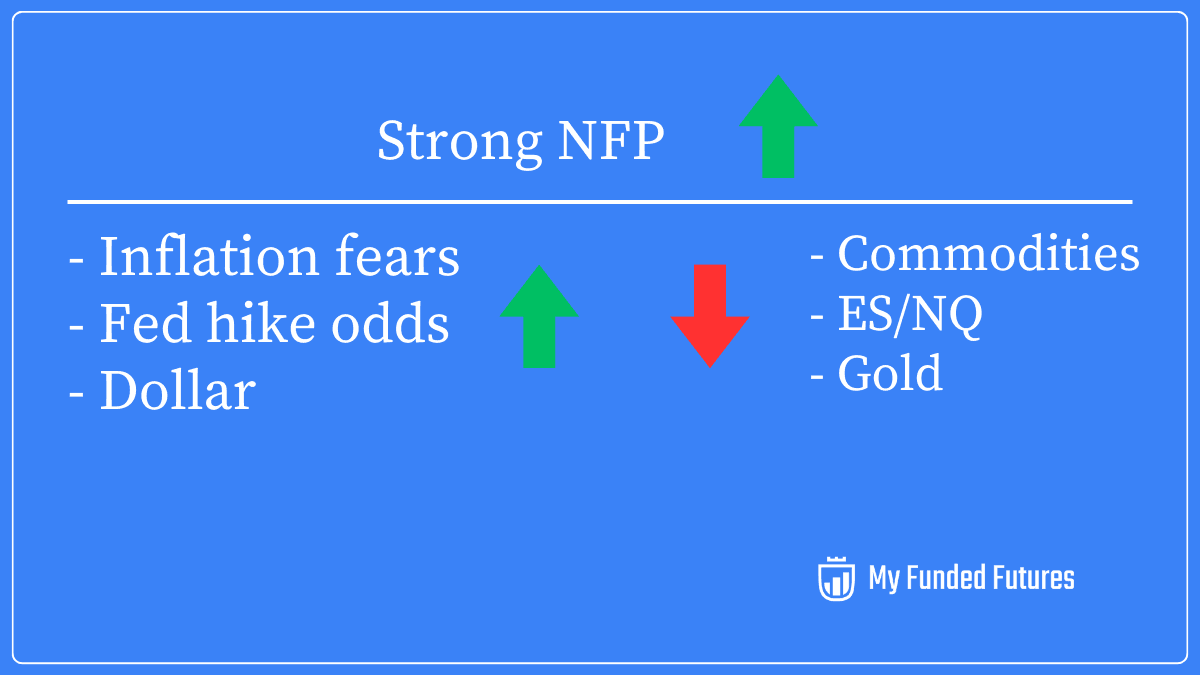
For commodities like energy or industrial metals, strong job growth can signal a boost in demand.
A healthy labor market means more industrial activity and consumer spending, supporting oil and metal prices.
On the flip side, weak payroll numbers signal economic slowdown, potentially dampening demand for energy and raw materials.
In times of economic stress when unemployment is rapidly rising, safe-haven commodities like gold may actually rise as investors seek safety, whereas growth-sensitive commodities like oil or copper would fall.
The NFP report is also a well-known market mover for stock indices. A stronger-than-expected jobs report typically boosts S&P 500 and Dow futures, reflecting confidence in economic strength and corporate earnings prospects.
However, extremely strong job gains can also spook index traders if they imply the Federal Reserve may tighten monetary policy to prevent an overheating economy.
Likewise, a weak payroll number can hurt index futures by raising recession fears. Yet, under the right circumstances, it might also spark rallies on the hope of Fed interest rate cuts to stimulate growth.
Big data releases like NFP can trigger intraday volatility that easily wipes out a funded trader’s daily loss limit. Many prop firms, including My Funded Futures, require traders to protect their trailing drawdown. Knowing the release calendar is as much about risk control as market insight.
Inflation Metrics
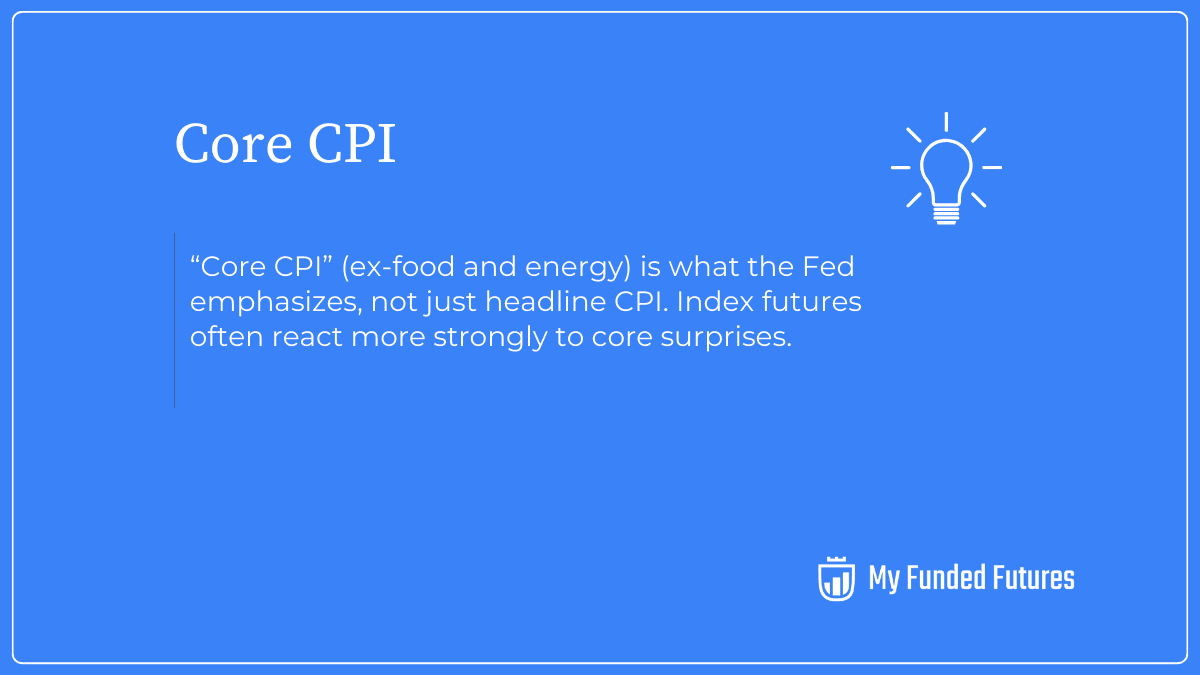
Inflation data, especially the Consumer Price Index (CPI) released monthly by BLS, is another fundamental indicator that futures traders must watch closely.
The CPI measures changes in the cost of a broad basket of goods and services, serving as a key gauge of price stability.
It is undoubtedly the most closely watched indicator of inflation in the U.S.
CPI release heavily influences expectations for Federal Reserve policy on interest rates.
For instance, U.S. headline CPI running at 2.9% year-over-year suggests moderate inflation, but an unexpected uptick could rattle markets by raising the prospect of tighter monetary policy.
Inflation can have a two-pronged impact on commodity futures.
When inflation roared in the 2000s, so did gold prices. Investors sought to hedge.
On the other side, sometimes high inflation leads to the Fed aggressively hiking interest rates, strengthening the US dollar. Global commodities are priced in the dollar, so the currency becoming stronger would push commodity prices down.
For S&P 500, Nasdaq indices futures, when inflation runs low and stable, it’s generally positive, as it implies predictable costs and accommodative interest rates.
A rising inflation, on the other hand, erodes consumer real incomes, squeezes corporate profit margins by increasing input costs and, most importantly, raises the specter of Fed interest rate hikes that make future earnings less valuable.
Traders often brace for volatility on CPI release days.
Monetary Policy
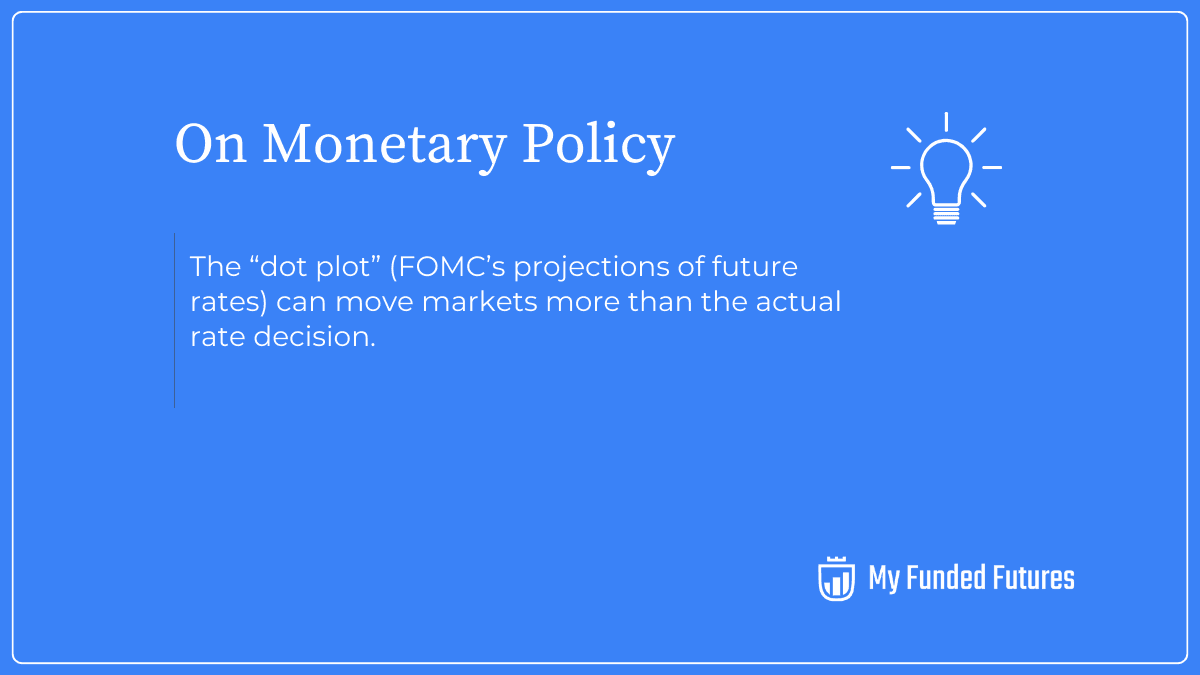
The Federal Reserve’s monetary policy decisions, particularly changes in the federal funds rate announced at FOMC meetings, are essential fundamentals for futures traders.
In recent years, markets have become highly sensitive to Fed guidance — even anticipation of policy shifts can whipsaw futures prices.
For example, the Fed’s signal of potential rate cuts or hikes can immediately be felt in stock index futures and in interest-rate-sensitive commodities like gold.
Interest rate policy often has an inverse relationship with commodity prices.
Higher interest rates tend to strengthen the U.S. dollar and increase the “carry cost” of holding commodities, which can suppress commodity demand and prices.
Academic research and historical data back this.
“Money announcements that caused interest rates to jump up would on average cause commodity prices to fall, and vice versa.” a research conducted by macroeconomist and Harvard Professor Jeffrey Frankel found in 2018.
This is because a rate hike usually lifts the dollar, making commodities more expensive in other currencies. This encourages investors to shift toward yield-bearing assets over non-yielding commodities.
Conversely, lower interest rates are supportive of commodities, they weaken the dollar and reduce financing costs, often fueling higher prices for gold, oil, and agriculture products.
Lower rates also decrease the opportunity cost of holding inventories, encouraging businesses to stockpile commodities, which can boost prices, as noted by the Federal Reserve Board itself.
In short, a dovish Fed typically bolsters commodity futures, while a hawkish Fed can undercut them.
Stock index futures are similarly highly sensitive to Fed policy, as interest rates directly impact corporate profits and equity valuations.
Rising rates increase companies’ borrowing costs and provide investors with higher-yielding alternatives like bonds, which often leads to lower stock prices.
An unexpected Fed rate hike or hawkish tone can send S&P 500 and Nasdaq futures downward.
On the flip side, falling interest rates or even a pause in hikes are generally seen as bullish for equities; cheaper money boosts investment and consumer spending, and future cash flows are valued more richly when discounted at a lower rate.
Pro Tip: Prop Firms have special rules around trading on news days. Check out MyFundedFutures’ policy on key data release days here.
Ready to dive in?
Explore our challenge accounts, pick the one that fits you best, and start your journey to getting funded.
Explore AccountsCommodity Supply & Demand Reports
Official supply and demand reports from U.S. agencies provide insights that are most useful for traders of commodity futures.
Two of the most important are the USDA’s agricultural reports and the Department of Energy’s EIA petroleum status reports.
These releases contain concrete data on production, inventories, and consumption that heavily influence prices for commodities like grains and energy.
The U.S. The Department of Agriculture’s World Agricultural Supply and Demand Estimates (WASDE) is released monthly.
It forecasts crop production, usage, exports, and ending stocks worldwide.
These reports often trigger sharp price movements in grain futures (corn, wheat, soy) immediately upon release.
For example, a lower-than-expected corn acreage or yield forecast in WASDE can spark a rally in corn futures, as the market prices in tighter future supply.
On the opposite end, bumper crop projections send prices tumbling. The buck stops with the USDA when it comes to grain markets and the USDA data is the most authoritative on crop sizes.
The Energy Information Administration (EIA) releases a Weekly Petroleum Status Report every Wednesday, detailing U.S. crude oil and refined product inventories, production, and demand. This data sets the tone for energy markets.
The level of oil inventories is a key fundamental driver of crude prices. Traders closely compare each week’s inventory build or draw against expectations.
Both the private API report, that comes Tuesday and the official EIA report, that comes Wednesday, can significantly move oil futures.
Oil and natural gas futures traders rely on the EIA report as a fundamental temperature check on the market.
A much larger-than-expected drawdown in crude stocks, for example, often sends WTI crude futures sharply higher, and vice versa.
Energy fundamentals can also spill over into equity indices, with the sector being a major component of major stock indices.
When oil prices surge on a big inventory draw or OPEC news, shares of oil producers like Exxon and Chevron typically rise, lending support to indices like the S&P 500.
Conversely, if EIA reports indicate a glut, energy stocks may fall and drag on indexes.
Oil is such an important commodity that its price influences inflation and the wider economy.
Market Positioning
The Commitment of Traders (COT) report, published weekly by the U.S. Commodity Futures Trading Commission (CFTC), is a unique indicator of market sentiment and positioning that many futures traders follow as part of fundamental analysis.
The COT breaks down the aggregate open interest in various futures markets by trader categories, such as commercial hedgers, managed money, and other large speculators.
It provides transparency into who is net long or short in each major futures contract.
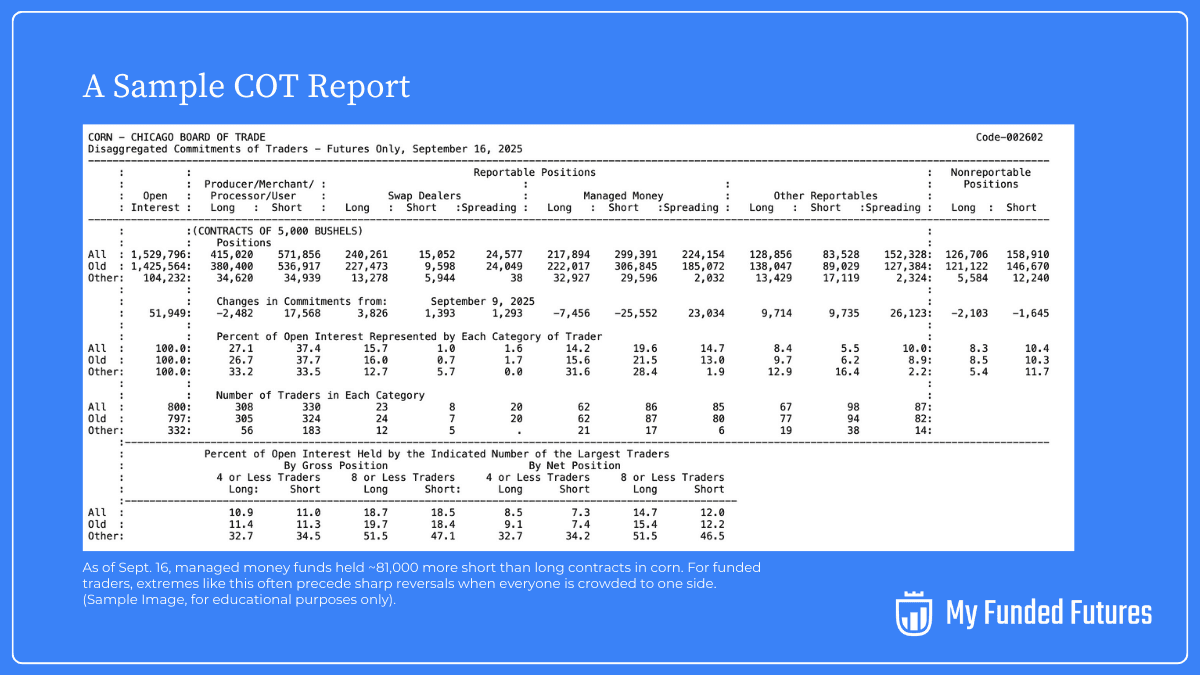
COT’s importance can’t be overstated and the report has been utilized by professional traders over decades as a contrarian or confirmation signal. In commodity futures, it highlights the positioning of commercial producers vs. speculators, which can reveal supply-side hedging pressure or speculative fervor.
For example, if the COT shows farmers are extremely short corn futures while speculators are extremely long, it may indicate that producers are locking in prices even as speculators are bullish — a warning of a price peak. Extremes in COT positioning often precede reversals: when all the “managed money” is on one side of a trade, the market may be overextended.
Whether you’re chasing your first evaluation or managing a $150K funded account, the traders who last are the ones who map fundamentals onto their trading plan.

Ready to Put Your Fundamentals Knowledge to Work? Get Funded Now.
¹This material is provided for educational purposes only and should not be relied upon as trading, investment, tax, or legal advice. All participation in MyFundedFutures (MFFU) programs is conducted in a simulated environment only; no actual futures trading takes place. Performance in simulated accounts is not indicative of future results, and there is no guarantee of profits or success. Fewer than 1% of participants progress to a live-capital stage with an affiliated proprietary trading firm. Participation is at all times subject to the Simulated Trader Agreement and program rules.
Frequently Asked Questions
Rate this article
Related Posts
Read our most popular posts

What is MyFundedFutures Flex Account and is it the Right Plan for You?
The Flex Plan offers low-cost access, minimal restrictions, flexible risk rules, and a clear, structured path from simulation to live trading.

Gold vs. Silver Futures: Key Differences and Which Should Beginner Traders Choose?
Precious metals are rallying on economic and geopolitical uncertainty; while futures offer leverage, gold’s stability and liquidity make it a safer starting point than silver for beginners.

What Is MyFundedFutures Scale Account and Is It The Right Plan For You?
The MyFundedFutures Scale Account is a middle-tier evaluation plan that balances affordability with growth potential. The scale plan offers weekly payout opportunities with increasing withdrawal limits, no daily loss cap, and a clear path to live funding after just five consecutive payouts.